During the postseason, I have been making series win probability charts. They’re available on the front page of the site and regularly on Twitter. I’ve also been calculating championship win probability (cWPA) added for all players. This is similar to single-game win probability added, but in the context of a postseason series. cWPA takes into account the level of postseason series. Each series is twice as important as the previous level. For example, the average play in the League Championship Series is twice as important as the average play in the Division Series. On the extreme ends, the World Series is eight times as important as the Wild Card game.
What follows are the top eleven plays during the 2015 postseason, according to championship win probability added. Note: .077 cWPA can be interpreted as increasing a team’s probability of winning the World Series by 7.7 percentage points.
1) Jose Bautista homers off Sam Dyson (.077 cWPA)
Game Five ALDS
Toronto’s ALDS win probability went from 64% to 94% on this swing. Whether you agree with the bat flip or not, you can’t deny the impact of the play. According to championship win probability added, it was the second biggest homerun by a Blue Jay in postseason history. Of course, the biggest was Joe Carter’s walk-off in Game Six of the 1993 World Series, which was worth .300 cWPA.
2) Jose Bautista homers off of Ryan Madson (.063 cWPA)
Game Six ALCS
Bautista lacks no flare for the dramatic. This homerun increased the Blue Jays series win probability by 13 percentage points (5% to 18%). While his homerun off Dyson a week earlier was a 30 point increase in series win probability, this one came in the ALCS, a round twice as important as the ALDS, making the two very comparable in value.
3) Luis Valbuena homers off of Johnny Cueto (.058 cWPA)
Game Five ALDS
The two runs from Valbuena’s shot were the first on the board in the deciding Game Five and they increased Houston’s series win probability from 42%-65%. Unfortunately for Valbuena and the Astros, they were unable to hold the lead.
4) Daniel Murphy homers off of Zack Greinke (.051 cWPA)
Game Five NLDS
This wasn’t the most memorable play of the series. That goes to the Chase Utley slide. It’s probably not even the most memorable of the game. That would be Murphy’s stolen base after the Lucas Duda walk. However, it did have the most impact. It increased New York’s series win probability from 41% to 62%, giving the Mets a lead they wouldn’t relinquish.
5) Edwin Encarnacion homers off of Cole Hamels (.051 cWPA)
Game Five ALDS
Encarnacion’s tied the game, albeit briefly, and increased Toronto’s series win probability from 39% to 60%.
6) Wade Davis strikes out Ben Revere (.048 cWPA)
Game Six ALCS
The biggest non-homerun of the postseason. Revere struck out in just 10% of his plate appearances during the regular season, but Davis was able to get him swinging with runners at 2nd and 3rd with one out in the 9th. However, there was an obviously questionable strike two call that should have been ball three. The strikeout increased the Royals series win probability from 83% to 92%.
7) Carlos Correa error, scoring two runs (.047 cWPA)
Game Four ALDS
This is an even bigger play when you consider the alternative, a double play that scores just one run. Instead, this play increased the Royals series win probability from 22% to 41%. Correa had been having a tremendous game, with two homeruns earlier. It should be noted that the ball did skip off of Tony Sipp’s glove, making for a very unusual hop for Correa.
8) Rougned Odor scores on Russell Martin’s error (.047 cWPA)
Game Five ALDS
The most bizarre play of the 2015 postseason, very unlikely to be topped. Choo’s bat, Martin’s misfortune and Odor’s heads-up base running increased the Rangers series win probability from 43% to 61%.
9) Eric Hosmer drives in Lorenzo Cain from first base (.045 cWPA)
Game Six ALCS
Multiple people deserve credit for this play. Hosmer for the single, Cain for the amazing hustle, Bautista for not hitting the cutoff man, and third base coach Mike Jirschele for the awareness to send Cain after Bautista threw to Tulowitzki. All-in-all, the play increased the Royals series win probability from 87% to 96%.
10) Daniel Murphy’s RBI double off of Zack Greinke (.042 cWPA)
Game Five NLDS
New York got an early run in the first inning on Murphy’s double. Kiké Hernandez had trouble picking up the ball off the wall, enabling Murphy to take third base. Murphy should be given credit for his hustle and not just coasting into second base. This play increased the Mets series win probability from 44% to 61%.
11) Javier Baez homers off of John Lackey (.042 cWPA)
Game Four NLDS
Baez, who was starting in place of the injured Addison Russell, gave the Cubs a lead on the first pitch from John Lackey. Baez was batting ninth, behind the pitcher Jason Hammel, who extended the inning on a single to center field. The homerun increased the Cubs series win probability from 70% to 84%.
It should be noted there are sure to be bigger plays in the World Series, given the bigger importance in the postseason’s highest level. In the 2014 postseason, the top 18 plays (according to cWPA) came in the World Series.
The Houston Astros and Kansas City Royals are headed for a decisive Game Five tonight. On Monday in Game Four, the Astros held a 6-2 lead and were just six outs from advancing to the ALCS. With one out in the bottom of the seventh, the Royals had a 0.8% series win expectancy. If Kansas City wins tonight, their comeback will go down as one of the greatest in postseason history. If they lose, it will be all for naught.
The following are the fifteen biggest comebacks in postseason history according to series win expectancy. These are comebacks from the brink of elimination, so you will not see single game comebacks such as Game Four of the 1929 World Series when the Athletics scored ten runs in the seventh inning after being down 8-0. This is because Philadelphia was not close to elimination.
Background:
In 2012, MLB added a second wild card. To fit the wild card game in between the end of the regular season and the beginning of the division series, they changed the format of the division series from 2-2-1 to 2-3 in order to eliminate an extra travel day. This made it more difficult for the Giants, who lost both games at home and would have to win the final three in Cincinnati.
Low Point:
During the second inning of Game Three, the Reds held a 1-0 lead. Cincinnati was just seven innings from completing the sweep against the Giants.
The Outcome:
The Giants tied the game and that score remained until extra innings when the Reds scored on an error to force a fourth game. San Francisco never trailed during Game Four and the big blow came in the fifth inning of Game Five on a Buster Posey grand slam off of Mat Latos.
Braves defeat Pirates (6.6% series win expectancy)
Background:
This was essentially the Pirates last opportunity at a World Championship. The nucleus of the team that lost both the 1990 and 1991 championship series was breaking apart. Barry Bonds and Doug Drabek were all but gone at the end of the season because the Pirates wouldn’t be able to compete with large market clubs in free agency.
While the Braves, with one of the best farm systems in baseball and the backing of billionaire owner Ted Turner, were looking for their second straight World Series appearance.
Low Point:
Going into the bottom of the ninth during Game Seven, Atlanta was down 2-0. They were facing Doug Drabek, who was just three outs away from a complete game shutout.
The Outcome:
The Braves quickly loaded the bases on a double, error, and a base on balls. Pirates manager Jim Leyland brought in his closer, Stan Belinda, in hopes of stopping the rally. Atlanta scored their first run on a sacrifice fly and reloaded the bases on a Damon Berryhill walk. A popout by pinch hitter Brian Hunter gave the Pirates their first out. With the pitcher’s spot due up, Braves manager Bobby Cox went with Francisco Cabrera, who had just eleven plate appearances all season.
In the outfield, Pirates center fielder Andy Van Slyke motioned to left fielder Barry Bonds to move in a few steps. Bonds did not oblige and it proved to be costly. Cabrera singled to left, easily scoring David Justice. Sid Bream rounded third as Bonds fielded the ball and threw home. The throw was a little off-line and Bream was safe by inches. Had Bonds moved in, most baseball fans might not be able to recognize Francisco Cabrera’s name.
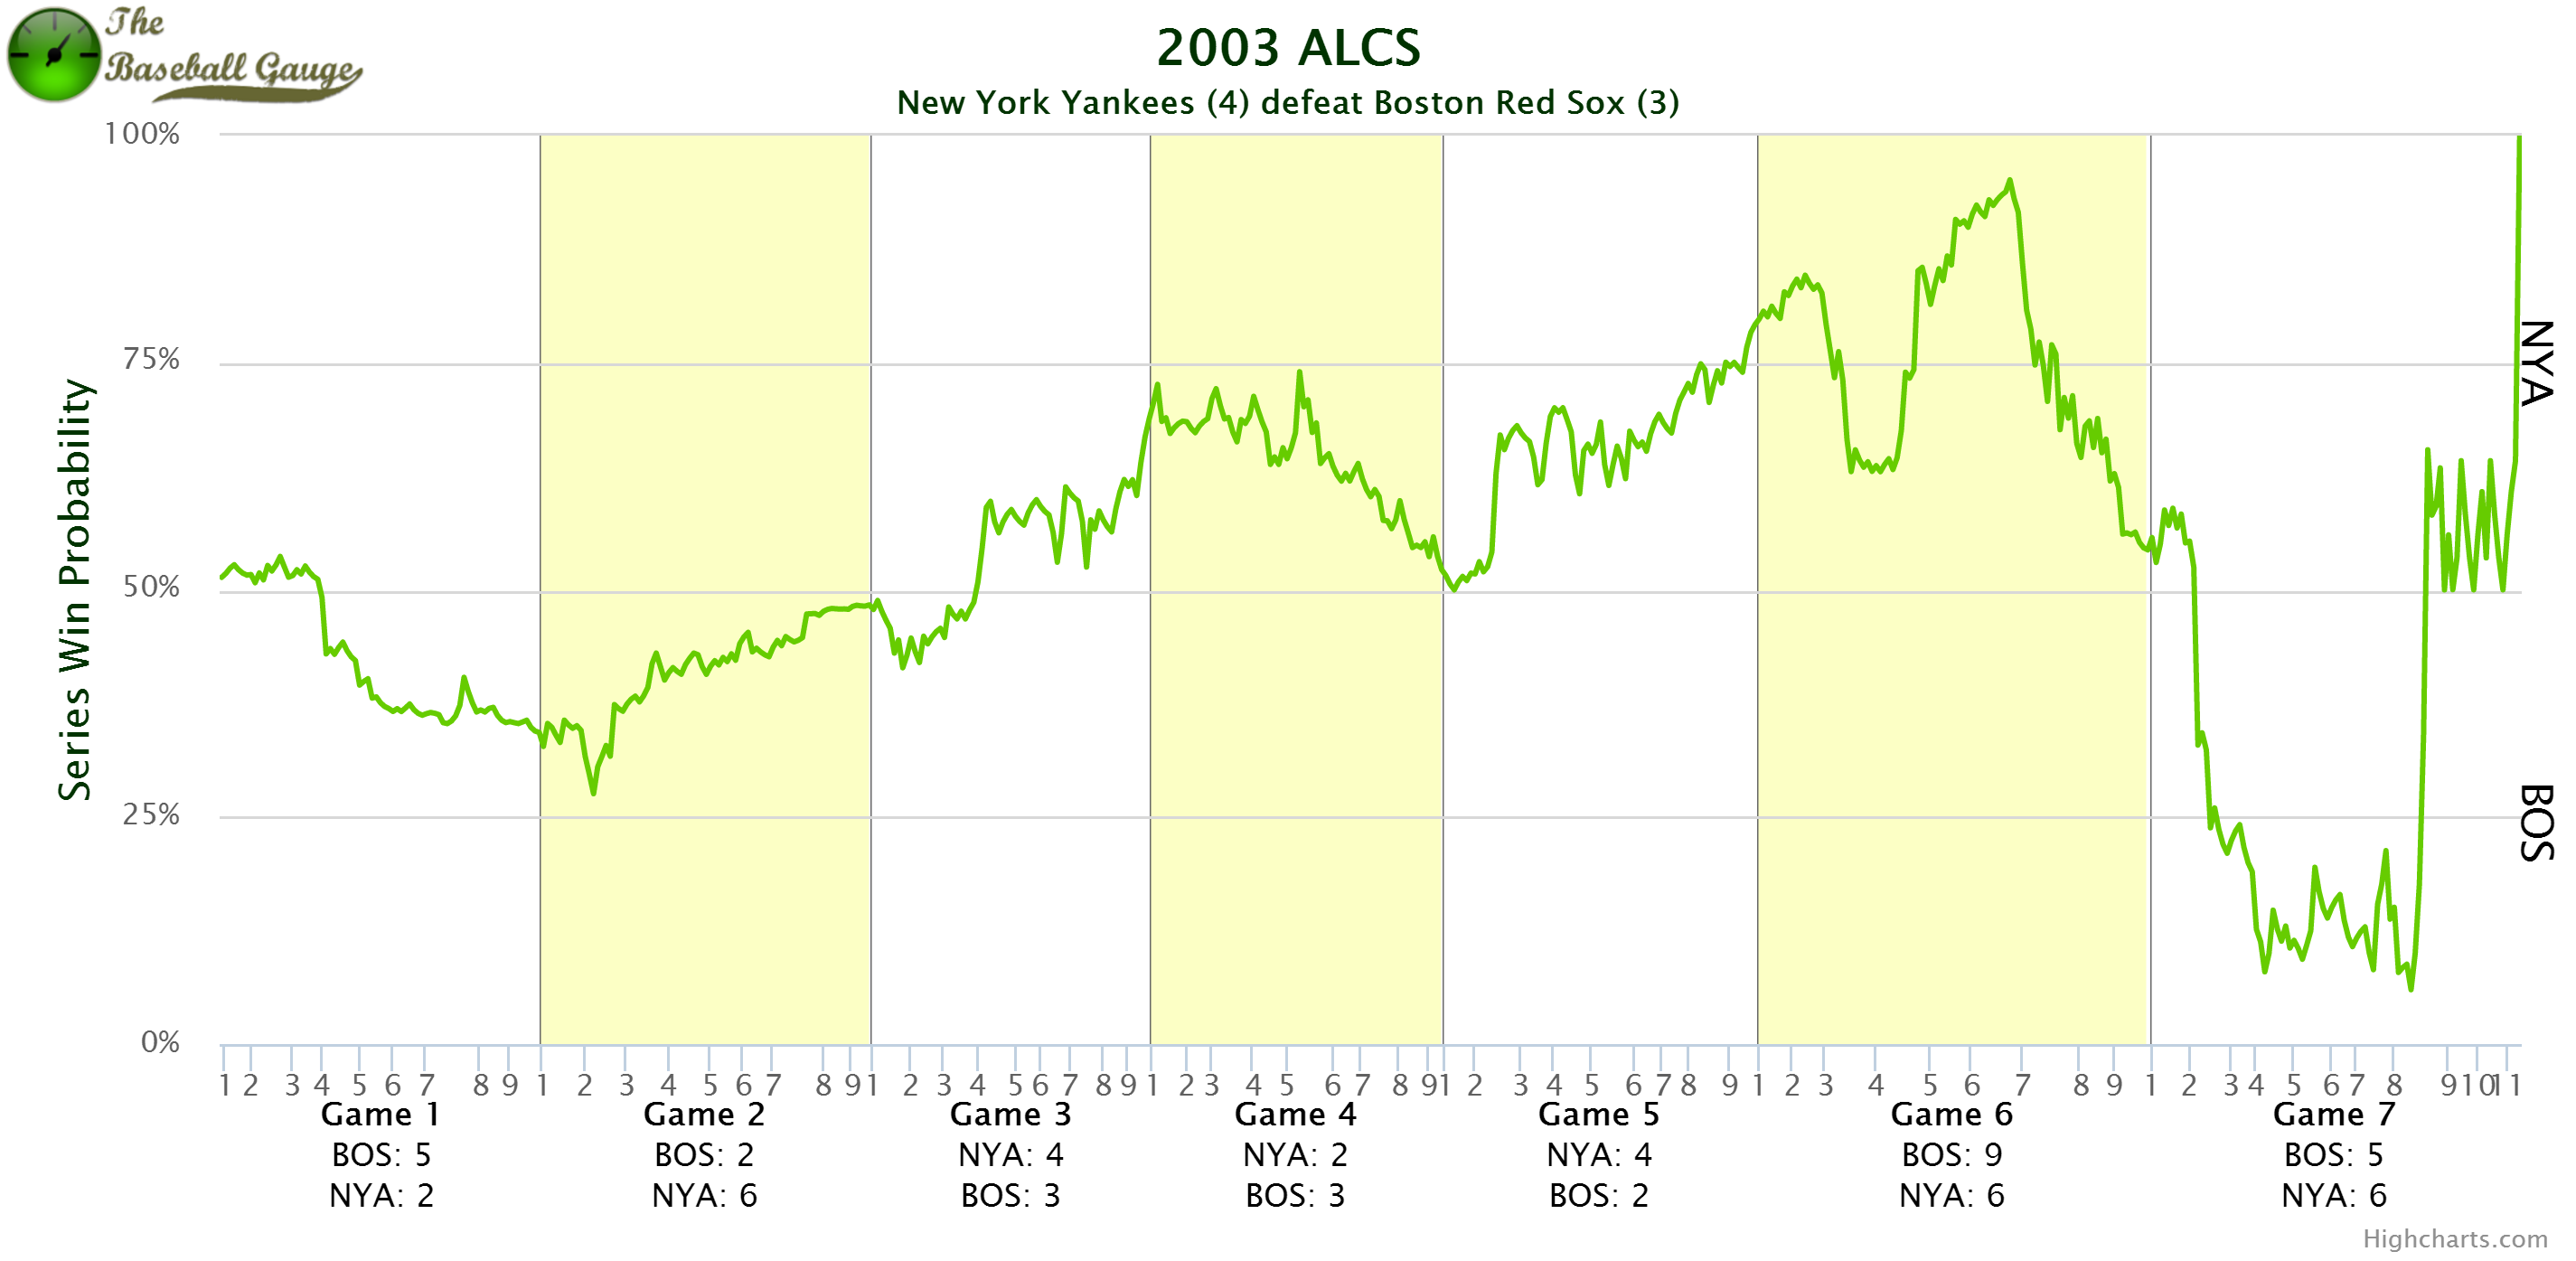
Yankees defeat Red Sox (6.0% series win expectancy)
Background:
It had been 85 years since the Red Sox last won a World Series. During that time, the rival Yankees had won 26 World Championships. It was known as “The Curse of the Bambino” and the Red Sox were going to have to get through their rival to end the suffering. The series was everything that Fox could have dreamed for and more. The two biggest markets, literally fighting their way to the World Series.
Low Point:
In the bottom of the eight in Game Seven, the Yankees were down 5-2 with just five outs remaining. On the mound for Boston was Pedro Martinez, who was going through arguably the most dominant stretch by any pitcher in baseball history.
The Outcome:
After the Yankees quickly scored their third run, Red Sox manager Grady Little went to the mound, but ultimately chose to stick with Martinez, rather than go with late inning relievers Mike Timlin or Alan Embree. The decision would ultimately be the defining moment in Little’s career as the Yankees tied the score just two batters later.
The game went into the 11th when Yankees third basemen Aaron Boone hit just the second pennant-clinching walk-off homerun in LCS history.
Pirates defeat Yankees (5.9% series win expectancy)
Background:
This was the classic David vs Goliath matchup. The Yankees were in their eleventh World Series in the last fourteen years while the Pirates were the champions of the senior circuit for the first time in 33 years. While the two teams split the first six games, the Yankees had outscored the Pirates 46-17.
Low Point:
In the top of the eighth in Game Seven, the Yankees scored two runs to increase their lead to 7-4. The Pirates had just six outs remaining vs Bobby Shantz.
The Outcome:
The bottom of the eighth began with three straight singles, which cut the lead to two. Yankees manager Casey Stengel replaced Shantz with Jim Coates, who then retired the first two batters he faced. Roberto Clemente followed with a single that cut the lead to one. That brought up backup catcher Hal Smith, who entered the game in the sixth inning. At the beginning of Smith’s plate appearance, the Pirates had a series win probability of 29%. Five pitches later, Smith hit the biggest series changing homerun in baseball history. The three-run shot gave the Pirates a 9-7 lead and a series win probability of 94%.
Unfortunately for Hal Smith and the Pirates, the Yankees scored two in the top of the ninth to tie the game. What followed would be the first World Series clinching Walk-Off homerun in history. The highlight of Bill Mazeroski dodging Pirates fans while waving his helmet around would be seen countless times by baseball fans. All while Hal Smith’s contribution would go largely forgotten.
Mariners defeat Yankees (5.7% series win expectancy)
Background:
The Mariners shouldn’t have been in the playoffs. On August 15th, they were 12.5 games behind the division leading Angels and had a 0.4% chance of winning the division. Over the final month and a half of the regular season, they battle back and won a one-game tiebreaker.
Low Point:
During the third inning of Game Four, the Yankees were up 5-0 and just six innings away from advancing to the ALCS.
The Outcome:
Seattle quickly scored four runs in the fourth inning and eventually took the lead for good in the eighth inning of Game Four, forcing a deciding Game Five.
Through seven innings of Game Five, New York held a 4-2 lead. Their starter David Cone, had thrown 118 pitches and went back to the mound to face the heart of the Mariners order in the eighth. A Ken Griffey Jr solo homerun and a Doug Strange bases loaded walk tied the game.
Randy Johnson, who had thrown seven innings just two days before, came in the ninth inning to stop a Yankees rally and then struck out the side in the tenth. The Yankees would finally get a run across on him in the eleventh, moving just three outs away from a series victory.
The bottom of the eleventh would go on to be arguably the greatest moment in Mariners history. Facing New York’s ace, Jack McDowell, Seattle would get back-to-back singles by Joey Cora and Ken Griffey Jr. Designated Hitter Edgar Martinez would follow with a two-run double down the left field line as Griffey came around to score the winning run. The 1995 Mariners created so much excitement in Seattle, they are often credited for saving baseball in the city, as they would soon get funding for what would become Safeco Field.
Cardinals defeat Nationals (3.7% series win expectancy)
Background:
After so many years in the basement of the National League East, Washington was finally benefiting from multiple early first round draft picks. During the regular season, they won a franchise record 98 games. The Cardinals were defending World Series champions and in their ninth postseason in the previous thirteen years.
Low Point:
The two clubs split the first four games, going into a deciding Game Five in Washington. The Nationals jumped out to a 6-0 lead, hitting three homeruns in the first three innings on Cardinals ace Adam Wainwright.
The Outcome:
St. Louis slowly chipped away, scattering five runs in the next five innings. They would go into the top of the ninth down by two, facing the Nationals closer Drew Storen.
A double and two walks loaded the bases with two outs. Daniel Descalso singled in two runs to tie the score and Pete Kozma singled in two more to take a 9-7 lead. Cardinals closer Jason Motte provided a perfect bottom of the ninth to advance to the NLCS.
Phillies defeat Astros (3.6% series win expectancy)
Background:
The Phillies, who have been in existence since 1883, were still looking for their first World Series championship. They had lost three of the last four NLCS.
Low Point:
During Game Four, in the bottom of the sixth inning, the Astros were leading 2-0 and had just loaded the bases with just one out. Houston was just three innings away from appearing in their first World Series.
The Outcome:
With right-handed batter Luis Pujols coming up with the bases loaded, Phillies manager Dallas Green chose to replace his ace Steve Carlton with right-handed reliever Dickie Noles. Pujols then flew out to rightfielder Bake McBride, scoring Gary Woods from third on the sacrifice fly. However, several Phillies noticed that Woods left the base before McBride made the catch. An appeal followed and Woods was declared out and the run was taken off the board, ending the inning.
Philadelphia then scored three runs in the eighth before allowing Houston to tie it in the ninth, forcing extra innings for the third straight game. In the tenth, two runs on a Pete Rose single, and doubles by Greg Luzinski and Manny Trillo put the Phillies up for good.
Game Five would be the fourth straight extra inning game. There were four lead changes with each team having at least a 90% probability of winning before blowing their lead. The 1980 NLCS would go down as one of the most exciting postseason series in baseball history.
Royals defeat Athletics (3.2% series win expectancy)
Background:
The Kansas City Royals had not appeared in the postseason since 1985
Low Point:
Through seven innings, Oakland was ahead 7-3 with their ace Jon Lester on the mound.
The Outcome:
In the eighth, the Royals cut the deficit to one run by scoring three while stealing four bases on Oakland’s backup catcher Derek Norris, Jon Lester, and Luke Gregerson (who replaced Lester midway through the inning).
In the bottom of the ninth, the Royals manufactured the tying run with a Josh Willingham single, another stolen base by pinch runner Jarrod Dyson, and a sacrifice fly by Nori Aoki. The game would remained tied until the twelfth when Oakland took another lead with a walk, wild pitch, and single. Kansas City would have to mount yet another come back. A Christian Colon single scored Eric Hosmer (who tripled) to tie the game. Colon stole the Royals seventh base of the game to get into scoring position. Finally, catcher Salvador Perez singled in the winning run down the left field line, advancing Kansas City to the division series.
Tigers defeat Cardinals (2.8% series win expectancy)
Background:
1968 was the year of the pitcher. Cardinals ace Bob Gibson posted a ridiculous 1.12 ERA while Tigers hurler Denny McLain became the first 30 game winner since Dizzy Dean in 1934.
Low Point:
St. Louis took three of the first four games of the series. In the fourth inning of Game Five, they held a 3-0 lead and had two runners aboard with just one out.
The Outcome:
On the mound for Detroit was Mickey Lolich, who would throw three complete games during the series and earn MVP honors. Lolich would quickly stop the threat in the fourth inducing a flyout and a strikeout. In the bottom half, the Tigers cut the lead to one with two triples, a sacrifice fly and single. They would take the lead for good in the seventh and force a Game Six (which was a 13-1 Tigers blowout).
Game Seven looked like a classic pitchers duel between Lolich and Gibson, with each club scoreless through six innings. In the top of the seventh, Gibson got two quick outs before Detroit started to rally. Norm Cash and Willie Horton each singled, but the big blow came on Jim Northrup’s two-run triple. Detroit held on to the lead and won their first World Series since 1945.
Background:
The Cubs had not won a World Series since 1908 and had not won a pennant since 1945, while the Marlins were looking for their second World Series appearance in their eleventh season.
Low Point:
In the top of the eighth in Game Six, the Cubs held a 3-0 lead and were just five outs away from returning to the World Series.
The Outcome:
After getting the first out of the inning, Cubs pitcher Mark Prior allowed a double to Marlins leadoff hitter Juan Pierre. The next batter, Luis Castillo lofted a flyball down the leftfield line in foul territory. In what would forever be known as the “Steve Bartman Incident”, Cubs leftfielder Moises Alou leaped at the wall, only to have the ball deflected by a fan going for the souvenir. Alou was visibly upset because it would extend the at bat, which turned into a base on balls. The next batter, Ivan Rodriguez singled in Pierre, cutting the lead to two runs.
The next play is the most pivotal of the series, and should be more infamous than the Steve Bartman interference. Marlins rookie Miguel Cabrera hit a routine groundball to shortstop Alex Gonzalez. It’s possible the Cubs could have turned an inning ending double play. At the least, they could settle for one out. But Gonzalez misplayed the ball, and the error loaded the bases with just one out. Seven more runs would score in the inning and the Marlins would live to see another day.
Game Seven got off to a poor start for the “North Siders” as Miguel Cabrera hit a three-run homerun off Kerry Wood. But that lead wouldn’t last long as the Cubs scored three in the second to tie it and another two in the third inning to take the lead. The Cubs were now eighteen outs away from the World Series. Whether it was the “Curse of the Billy Goat“, bad luck or poor performance, the Marlins re-took the lead for good in the fifth inning, advancing to the Fall Classic.
Cardinals defeat Rangers (2.1% series win expectancy)
Background:
The Rangers were back in the World Series after losing in 2010 to the Giants. The Cardinals were in their eighth postseason in the previous twelve years.
Low Point:
In the bottom of the ninth inning of Game Six, the Rangers led 7-5 and were just two outs away from a World Series championship.
The Outcome:
Facing Texas closer Neftali Feliz, Albert Pujols doubled into the left-centerfield gap. The next batter, Lance Berkman drew a four-pitch walk, putting the tying run on base. Feliz got Allen Craig to strikeout for the second out of the inning. The Rangers outfield was playing deep in hopes to limit any hit to a single. Unfortunately, rightfielder Nelson Cruz was not playing deep enough as David Freese lined a ball just out of his reach and off the wall, bringing in both runs and to tie the score.
The Cardinals “momentum”, however, was short lived as in the top of the tenth inning, Josh Hamilton hit a two-run homerun off of Cardinals closer Jason Motte. Surely this would be enough to give the Rangers their first World Championship. But in the bottom half, the Cardinals manufactured two runs on three singles, a sacrifice bunt and an RBI groundout. The game was yet again tied.
After Jake Westbrook held the Rangers scoreless in the top of the eleventh, ninth inning hero David Freese came to plate. On a full-count and the seventh pitch of the at bat, Freese hit a walk-off homerun to dead center, forcing a Game Seven. As the ball cleared the fence, play-by-play announcer Joe Buck told the audience “We will see you tomorrow night”. This was a nod to his late father, who twenty years earlier in the 1991 World Series used the same line when Kirby Puckett hit a walk-off homerun.
In Game Seven, the Rangers once again took a two-run lead in the first inning on doubles by Josh Hamilton and Michael Young. The lead would be short-lived as the Cardinals answered back with two of their own in the bottom of the first. In the second, David Freese added to his story with a two-run double. This is all the Cardinals would need as they held the Rangers scoreless the rest of the way.
Red Sox defeat Yankees (1.8% series win expectancy)
Background:
After the disappointment of losing the 2003 ALCS, the Red Sox were facing the Yankees once again a year later.
Low Point:
This time around, the Yankees took the first three games and looked to be well on their way to another American League pennant. No team in baseball history had ever come back from being down 3-0 in a seven game series.
In the top of the ninth in Game Four, the Yankees held a 4-3 lead as Derek Jeter led off with a walk.
The Outcome:
Closer Keith Foulke, in his second inning of work, quickly retired the side on a groundout, strikeout and popup. Just after midnight in the bottom half of the inning, with three outs remaining, Kevin Millar drew a walk against future Hall of Famer Mariano Rivera. With the tying run on base, Boston manager Terry Francona replaced Millar with pinch runner Dave Roberts. With Bill Mueller at the plate, Roberts drew three straight pickoff throws from Rivera. But on the first pitch of the at bat, Roberts took off and slid into second base, just ahead of the throw from Jorge Posada. It was the biggest stolen base in Red Sox history. The next pitch, Mueller showed bunt but wisely pulled back. On the third pitch, Mueller shot a groundball into center to tie the score. The game would go into the twelfth inning, when David Ortiz hit a two-run walk-off homerun off of Paul Quantrill.
Game Five would last fourteen innings and ended on another walk-off hit by David Ortiz. This time it was an RBI single scoring Johnny Damon.
Game Six was back in New York and was known as the “Bloody Sock Game”. Red Sox starter Curt Schilling would need a tendon in his right ankle temporarily sewn in place, allowing him to pitch. Schilling went seven innings and allowed one run, earning the win and forcing the series to to a seventh game.
Game Seven was the least competitive of all the games as Boston jumped out to an early 6-0 lead, capped off by a Johnny Damon grand slam in the second inning. The Red Sox became the first team in history to win the final four games after losing the first three.
Background:
The Anaheim Angels were in the World Series for the first time in their 42nd year of existence. The Giants were looking for their first World Series championship since their New York days in 1954.
Low Point:
In the bottom of the seventh inning in Game Six, the Giants held a 5-0 lead, just eight outs away from winning the World Series.
The Outcome:
With Giants starter Russ Ortiz still on the mound in the seventh, the Angels got two runners aboard on singles by Troy Glaus and Brad Fuller. With thunder sticks banging and the Rally Monkey jumping, Scott Speizio took Giants reliever Felix Rodriguez deep to cut the lead to two runs. It would take the Giants two more relievers to stop the rally and keep the two-run lead.
In the eighth, lead-off hitter Darin Erstad cut the lead to one run with a solo shot off of Tim Worrell. That was followed by Tim Salmon and Garret Anderson singles, with still nobody out. Giants manager Dusty Baker then decided to bring in his closer Robb Nen to stop the bleeding. However, Troy Glaus, the first batter to face Nen, drove in the tying and go-ahead runs on a double. The Angels lead would stand as they forced a final game.
San Francisco got out to an early Game Seven lead in the second inning on a sacrifice fly by Reggie Sanders. This would not last long as the Bengie Molina would tie the score in the next half with an RBI double. A bases-clearing double by Garret Anderson in the third innging brought the score to 4-1 and the Angels the first World Series championship.
Red Sox defeat Angels (0.8% series win expectancy)
Background:
It had been 68 years since the Red Sox had last won a World Series and their last appearance in the fall classic in 1975 would end in heartbreak. The Angels were looking for their first World Series appearance in their 26 year history.
Low Point:
California took three of the first four games and held a 5-2 lead through eight innings of Game Five. They were just three outs away from going to the World Series.
The Outcome:
In the top of the ninth, facing Angels starter Mike Witt, had one aboard on a Bill Buckner single and two outs remaining. Red Sox designated hitter and former Angels MVP Don Baylor cut the lead to one on a two-run homerun. Witt would get the next batter, Dwight Evans, to pop up for the second out. Angels manager Gene Mauch finally replaced Witt with reliever Gary Lucas, who would hit Rich Gedman on the first pitch. With the tying run aboard, Mauch brought in his closer Donnie Moore to face Dave Henderson. Henderson deposited the seventh pitch over the left field wall to take the lead. As a child, I thought that Henderson jumped six feet into the air as he watched the ball clear the fence. While his vertical leap is not 72 inches, he did get some major hang time.
What is often forgotten in this game is the Angels tied the score in the bottom of the ninth on a Rob Wilfong RBI single. The score would remained tied until the eleventh inning when Dave Henderson would once again come up to face Donnie Moore, this time with the bases loaded and no outs. Henderson drove in another run on a sacrifice fly to center fielder Gary Pettis. This lead would hold and Boston would live to see another day.
Boston easily won Game Six 10-4 and Game Seven 8-1 to get another shot at the World Series.
Background:
After Boston came back from having a 0.8% win expectancy in the ALCS, they were set to face the 108-win New York Mets in the World Series.
Low Point:
In the bottom of the tenth inning of Game Six, the Red Sox held a 5-3 lead with just two outs and the bases empty.
The Outcome:
The Mets’ last hope, catcher Gary Carter, singled to left. The pitcher’s spot was up next, so Mets manager Davey Johnson called on pinch hitter Kevin Mitchell, who lined the next pitch into center, moving Carter to second base. Ray Knight, the potential go-ahead run, lined an 0-2 pitch to right-center, scoring Carter and cutting Boston’s lead to one run.
Red Sox manager John McNamara chose to replace Schiraldi with Bob Stanley, who would uncork a wild pitch on the eighth pitch vs Mookie Wilson. This tied the game as Kevin Mitchell crossed the plate, while Ray Knight moved to second base. The next play would be the defining moment in first basemen Bill Buckner’s career. Mookie Wilson grounded the next pitch down the first base line in what looked to be a routine groundout to end the inning. Unfortunately for Buckner and the Red Sox, the ball scooted through his legs as Knight came around to score the winning run.
Boston took a three-run lead in the third inning of Game Seven, on solo homeruns by Dwight Evans and Rich Gedman and an RBI single by Wade Boggs. That lead lasted until the sixth when the Mets scored three of their own to tie the game. New York would score three more an inning later and that would be all they would need for the first World Series championship since 1969.
While Bill James was writing his Abstracts in the 1980’s, he came up with Similarity Scores, which puts a number on how similar the statistics are from two different players. Scores can range from 1000 for the most identical players to 0 for the most dissimilar. Consider that two players that are very much alike in Andre Thornton and John Mayberry Sr, who have a similarity score of 974 while Neifi Perez and Babe Ruth have a similarity score of 0.
I decided to take this concept and apply it to the winning percentages of teams in a single season and compare it to teams in other seasons. The method is very simple:
Find the difference between each team’s winning percentage from the two seasons being compared. For example, the New York Yankees in 2015 had a winning percentage of .537 while the Yankees of 1927 had a winning percentage of .714. The difference is .177 (.714-.537). Do this for all teams and find the average. Then multiply that average by 1000 and subtract it from 1000. Two identical seasons would have a score of 1000.
When comparing years with expansion teams (1961-present) to years before expansion (1901-1960), I only included teams that were active during the two seasons. So when comparing 2015 to 1915, only 16 teams will be included in the comparison since 14 teams were not active in 1915.
I was most curious to see which season is the most similar to 2015. Surprisingly (I guess any season before 2010 would surprise me), the most similar season to 2015 is 1945, which had a similarity score of 966. In fact, this is the second closest match (highest score) between two seasons in the entire history of baseball.
2015 vs 1945 (Similarity Score: 966):
Of course, when comparing 2015 to 1945, we are only considering the winning percentages of 16 of the 30 teams. So if we limit our search to the 30-team era (1998-2015), we’ll find that the most similar season to 2015 is …… 2014. Kind of boring, I know. But it’s natural that the most similar seasons are sequential since that is when team’s will have the most similar personnel.
2015 vs 2014 (Similarity Score: 937):
Now what if we want to see which season is most dissimilar to 2015 during the 30-team era? That would go to the 2002 season.
2015 vs 2002 (Similarity Score: 908):
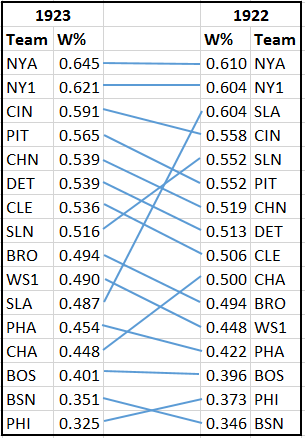
Which two seasons in history have the most similar winning percentages? The 1922 and 1923 seasons. Again, back-to-back seasons are more likely to have higher scores because their team’s have changed the least.
1923 vs 1922 (Similarity Score: 968):
Next, these two seasons have the most dissimilar winning percentages:
1953 vs 1909 (Similarity Score: 819):
Finally, I’ve included a list of the top and bottom 15 similarity scores of all-time:
One of my pet peeves in baseball is when an announcer mentions a stat without giving any context. It’s lazy and misleading and it’s usually done with counting stats. For example, both A.J. Pierzynski and Prince Fielder have grounded into 19 double plays this season, but Pierzynski has done it in 60 fewer opportunities. Opportunities are defined as plate appearances with a runner on first with less than two outs.
Why do opportunities need to be considered? Not all plate appearances are created equal. Lead-off batters are guaranteed to have one plate appearance per game that will not end up in a double play. Teams with high on base percentages as a whole, will have more opportunities because they have more players reaching first base. Players in the 2/3/4/5 spots in the lineup will have more opportunities because the hitters in front of them will reach base more often (assuming proper lineup construction).
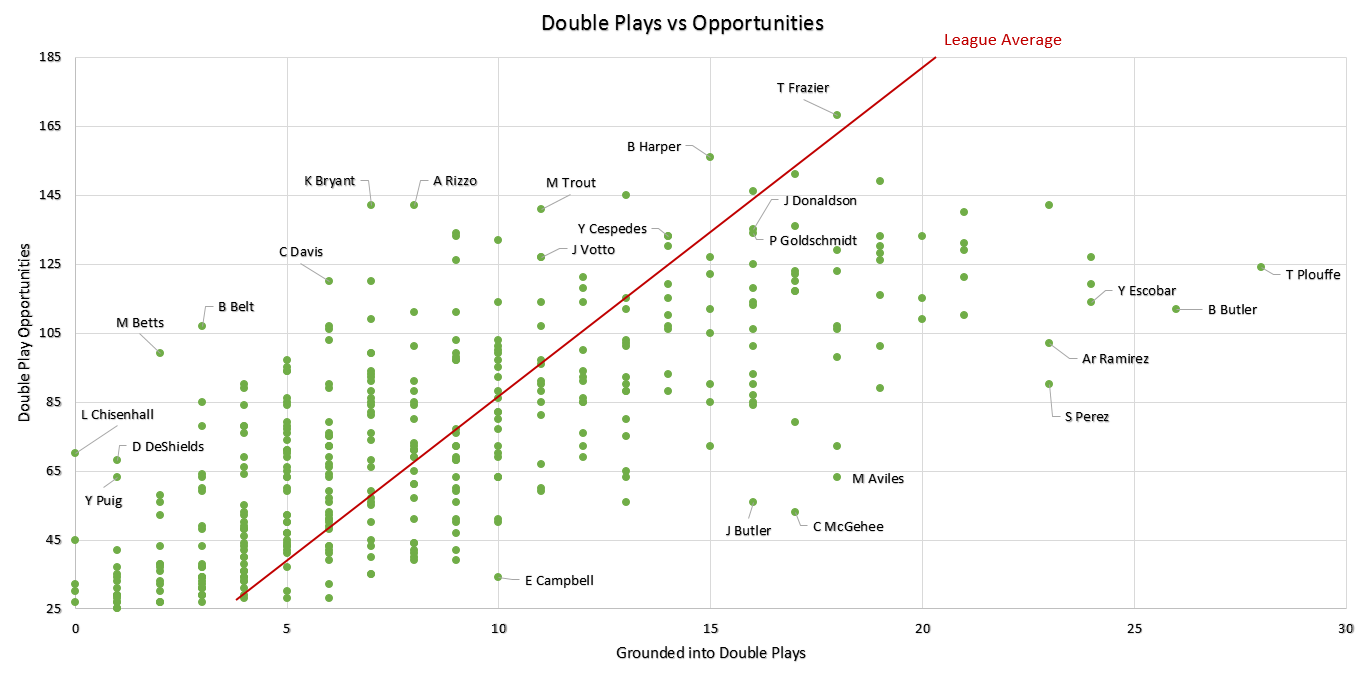
To show this graphically, I decided to make a scatter plot for double plays and double play opportunities. It includes all players with at least 25 opportunities this season.
The red line shows the league average double play rate, which is around 11% of opportunities. Basically, the farther away from the line to the top left, the better the player has been at avoiding double plays. Conversely, the farther from the line to the bottom right, the worse they are. I added labels for the biggest outliers and most notable offensive players.
Some things the players on the top left have in common:
– Left-handed. Left-handed batters are a few feet closer to first base, so their time to first is, on average, shorter.
– Speed. This is simple. Faster players will beat out more throws to first than slower players.
– Flyball hitters. Fewer ground balls, fewer double plays.
– High strikeouts: You can’t ground into a double play if you don’t put the ball in play.
A couple of notes:
– Lonnie Chisenhall has had 70 opportunities and has yet to ground into a double play.
– The Cubs Rizzo and Bryant have combined for 284 opportunities and have grounded into 15 double palys (8 and 7 respectively). Compare that to Yasmany Tomas who has grounded into 15 double plays in just 72 opportunities.
– It’s no coincidence that the games best hitters (Trout, Harper, Donaldson, Goldschmdit, Votto, etc are all at league average or better.
Suppose the World Series winner from the previous season held a championship they had to defend every game, sort of a “championship belt”. I’ll call this the “traveling championship”. Once the traveling champion loses, the championship is then transferred to the team that beat them. Then, that team goes on to defend the title. This goes on until the end of the regular season and the last team to hold the title is the “Traveling Champion”.
You might ask: What does this tell us?
Nothing. Absolutely nothing.
Is the “traveling champion” the best team?
Most likely no.
Why do this?
It’s fun, or at least I think it is.
Without further adieu, the current 2015 Traveling Champion is the Cleveland Indians. Here is how it got there:
Date
Champion
Defeated
4/7
ARI
SFG
4/8
SFG
ARI
4/10
SDP
SFG
4/13
ARI
SDP
4/14
SDP
ARI
4/18
CHC
SDP
4/19
SDP
CHC
4/22
COL
SDP
4/25
SFG
COL
4/27
LAD
SFG
4/28
SFG
LAD
4/29
LAD
SFG
5/4
MIL
LAD
5/5
LAD
MIL
5/6
MIL
LAD
5/7
LAD
MIL
5/13
FLA
LAD
5/15
ATL
FLA
5/19
TBD
ATL
5/20
ATL
TBD
5/22
MIL
ATL
5/23
ATL
MIL
5/25
LAD
ATL
5/27
ATL
LAD
5/28
SFG
ATL
5/30
ATL
SFG
6/2
ARI
ATL
6/4
NYM
ARI
6/5
ARI
NYM
6/7
NYM
ARI
6/9
SFG
NYM
6/11
NYM
SFG
6/13
ATL
NYM
6/14
NYM
ATL
6/17
TOR
NYM
6/20
BAL
TOR
6/24
BOS
BAL
6/25
BAL
BOS
6/29
TEX
BAL
7/1
BAL
TEX
7/2
TEX
BAL
7/3
ANA
TEX
7/9
SEA
ANA
7/10
ANA
SEA
7/11
SEA
ANA
7/12
ANA
SEA
7/23
MIN
ANA
7/25
NYY
MIN
7/29
TEX
NYY
8/1
SFG
TEX
8/2
TEX
SFG
8/7
SEA
TEX
8/8
TEX
SEA
8/9
SEA
TEX
8/10
BAL
SEA
8/11
SEA
BAL
8/14
BOS
SEA
8/16
SEA
BOS
8/17
TEX
SEA
8/18
SEA
TEX
8/19
TEX
SEA
8/20
DET
TEX
8/21
TEX
DET
8/25
TOR
TEX
8/27
TEX
TOR
8/31
SDP
TEX
9/1
TEX
SDP
9/4
ANA
TEX
9/5
TEX
ANA
9/6
ANA
TEX
9/7
LAD
ANA
9/9
ANA
LAD
9/13
HOU
ANA
9/14
TEX
HOU
9/18
SEA
TEX
9/19
TEX
SEA
9/20
SEA
TEX
9/23
KCR
SEA
9/25
CLE
KCR
Here is the number of games each team has successfully defended the championship:
It’s time to change the playoff seeding, just as the NBA did recently.
The following is each division’s record vs non-divisional opponents during the wild card era (1994-present). As you can see, the NL Central (.555) has the seventh best winning percentage of any division, which equates to a 90-72 record over 162 games.
The NL East, however, has the fourth worst winning percentage (.424), which equates to a 69-93 record.
Year
Lg
Div
W
L
W-L%
2002
AL
West
251
165
0.603
2001
AL
West
250
166
0.601
2008
AL
East
255
194
0.568
2012
AL
West
237
183
0.564
2013
AL
East
243
188
0.564
2010
AL
East
251
199
0.558
2015
NL
Central
228
183
0.555
1998
AL
East
316
254
0.554
2003
NL
East
237
192
0.552
2011
AL
East
248
202
0.551
1994
AL
Central
205
168
0.550
2009
AL
West
230
190
0.548
2005
NL
East
239
199
0.546
2002
NL
West
234
195
0.546
1994
NL
East
208
175
0.543
1997
AL
East
307
263
0.539
1997
NL
East
307
263
0.539
2006
AL
West
226
194
0.538
2000
NL
West
298
256
0.538
2013
NL
Central
231
199
0.537
2004
NL
Central
232
200
0.537
2006
AL
Central
233
201
0.537
2007
NL
West
241
209
0.536
2009
AL
East
241
209
0.536
2002
NL
East
229
199
0.535
2001
NL
West
230
200
0.535
2011
NL
East
240
209
0.535
2009
NL
West
240
210
0.533
2012
AL
East
240
210
0.533
1999
AL
East
300
264
0.532
2003
AL
West
221
195
0.531
2008
NL
Central
263
233
0.530
2015
AL
East
218
196
0.527
2004
AL
West
219
197
0.526
1997
NL
West
265
239
0.526
2003
AL
East
226
204
0.526
1994
AL
East
215
195
0.524
2012
NL
East
236
214
0.524
2010
NL
East
236
214
0.524
1996
AL
Central
287
261
0.524
2004
AL
East
225
205
0.523
2000
AL
West
260
237
0.523
2007
AL
West
219
201
0.521
1995
AL
West
220
202
0.521
2005
AL
West
219
205
0.517
1996
NL
West
254
238
0.516
2014
AL
East
221
209
0.514
1999
AL
West
258
244
0.514
2005
AL
East
226
214
0.514
1998
NL
Central
327
310
0.513
2015
AL
Central
212
201
0.513
2014
AL
West
220
210
0.512
2006
NL
East
225
215
0.511
1998
NL
West
292
279
0.511
2010
NL
West
230
220
0.511
1995
NL
West
214
206
0.510
2014
NL
Central
219
211
0.509
2000
AL
Central
286
276
0.509
1999
NL
West
282
274
0.507
2007
AL
East
228
222
0.507
1999
NL
East
283
276
0.506
2005
NL
Central
251
245
0.506
2003
NL
West
217
212
0.506
1994
NL
Central
183
179
0.506
2014
AL
Central
217
213
0.505
1995
NL
East
231
228
0.503
1999
NL
Central
301
297
0.503
2011
NL
West
226
223
0.503
2008
AL
Central
226
224
0.502
2007
NL
East
225
225
0.500
1996
AL
West
245
245
0.500
1998
AL
West
251
252
0.499
2006
NL
West
217
218
0.499
2007
AL
Central
224
226
0.498
1995
AL
Central
231
233
0.498
2014
NL
East
214
216
0.498
2011
AL
West
209
211
0.498
2004
NL
East
213
217
0.495
1996
NL
East
272
278
0.495
2015
AL
West
205
210
0.494
2005
AL
Central
215
221
0.493
2000
NL
East
274
283
0.492
2012
NL
West
221
229
0.491
1996
NL
Central
270
280
0.491
2006
AL
East
215
223
0.491
2000
AL
East
275
287
0.489
2013
AL
Central
210
220
0.488
2001
NL
East
210
220
0.488
1995
NL
Central
227
238
0.488
2015
NL
West
202
212
0.488
2010
AL
Central
219
231
0.487
2013
NL
West
209
221
0.486
1997
AL
West
244
260
0.484
1995
AL
East
222
238
0.483
2008
NL
East
217
233
0.482
2002
AL
East
207
223
0.481
2008
AL
West
201
218
0.480
2009
NL
East
215
235
0.478
1996
AL
East
262
288
0.476
2010
AL
West
198
222
0.471
1998
NL
East
268
302
0.470
2003
NL
Central
220
248
0.470
2013
NL
East
201
229
0.467
2009
NL
Central
232
266
0.466
2001
NL
Central
218
250
0.466
2001
AL
Central
200
230
0.465
2004
NL
West
200
230
0.465
2014
NL
West
199
231
0.463
2011
AL
Central
208
242
0.462
1997
AL
Central
261
309
0.458
2013
AL
West
197
234
0.457
1997
NL
Central
260
310
0.456
2011
NL
Central
226
270
0.456
2000
NL
Central
272
326
0.455
2012
NL
Central
225
271
0.454
2004
AL
Central
195
235
0.454
2010
NL
Central
227
275
0.452
2001
AL
East
194
236
0.451
1998
AL
Central
256
313
0.450
1994
NL
West
156
193
0.447
2009
AL
Central
201
249
0.447
2007
NL
Central
221
275
0.446
2012
AL
Central
199
251
0.442
1999
AL
Central
248
317
0.439
2008
NL
West
195
255
0.433
2006
NL
Central
210
275
0.433
2002
NL
Central
184
247
0.427
2005
NL
West
189
255
0.426
2015
NL
East
175
238
0.424
2003
AL
Central
180
250
0.419
1994
AL
West
144
201
0.417
2002
AL
Central
177
253
0.412
The top three teams in the National League Central also have the three best records in the league. If the season ended today, two of them would have to settle for a one game “play-in”, just to enter the tournament. This type of situation wasn’t as big of a problem before the addition of the second wild card in 2012, when all playoff teams were in the tournament. But now, it is unfair to force better teams to have to win a one game crap shoot.
If we are stuck with three divisions and five playoff teams, I would rather see all division winners plus two wild card teams advance to the playoffs with the caveat that the two teams with the worst record face each other in the “play-in” game. Admittedly, it’s not perfect, but it is better than what we have now.
Just like Yogi Berra said, “It ain’t over ’til it’s over”. Year after year, we watch magic numbers and debate whether or not a team is “done” or if they still have a chance to make the playoffs. Pennant races are one of the countless reasons that make the game of baseball so unique. Some teams, like the 1984 Tigers, go the entire season without much of a fight from their rivals. Some, like the 2007 Mets, get so close to making the postseason, just to have it slip out of their hands. Others, stage what seem like improbable comebacks, after most, if not all fans have counted them out. Here are the nine greatest comebacks in baseball history.
Note: Earlier in the year, I added historical pennant race graphs to the site. These are pennant and wild card win expectancies from every single day in baseball history (1871-present). These expectancies are figured by simulating the remaining schedules 100,000 times, which over the course of baseball history, is 1.7 trillion game simulations. The best way to look at pennant win expectancy is based on a team’s record, the records of their divisional/league opponents and the remaining schedule, this is the probability that they will win the pennant.
The Challenge:
On September 4th, the Cardinals were tied for second place with the Cubs, seven games behind the defending champion New York Giants. Of the 25 games left to play, St. Louis was scheduled to face teams in the second division 18 times. How they did it:
The Gas House Gang’s pitchers were led by brothers Dizzy and Paul Dean, who won 49 games between the two of them. They started 13 and won 12 of the team’s final 25 games. St. Louis would tie the Giants for first place on September 28th, with two games remaining.
Before the season began, Giants manager and first basemen Bill Terry was asked how he felt about the Brooklyn Dodgers chances in the upcoming season. He responded “I haven’t heard anything from them lately. Are they still in the league?” Fate would have it that the Giants final two games would come against those same Dodgers. With the Cardinals Paul and Dizzy Dean facing the last place Reds for their final two games, the Giants had a tough battle ahead. Sure enough, the Dodgers were still in the league and would beat the Giants in both games while the Cardinals won their two to advance to the World Series. World Series:
In the World Series, St. Louis faced the 101-win Detroit Tigers, led by future Hall of Famers Hank Greenberg, Charlie Gehringer, Mickey Cochrane & Leon “Goose” Goslin. Down 3 games to 2, the Cardinals tied the series with a late go ahead run in game six. Game seven was a 11-0 route, which included Cardinals left fielder Joe “Ducky” Medwick being forced to leave the field by Commissioner Landis, since Tigers fans were hurling objects in his direction. Medwick had slid hard into third base during the sixth inning, further angering fans who were already down due to their team’s grim prospects. At the time of Medwick’s removal, the Tigers had a 1% series win expectancy.
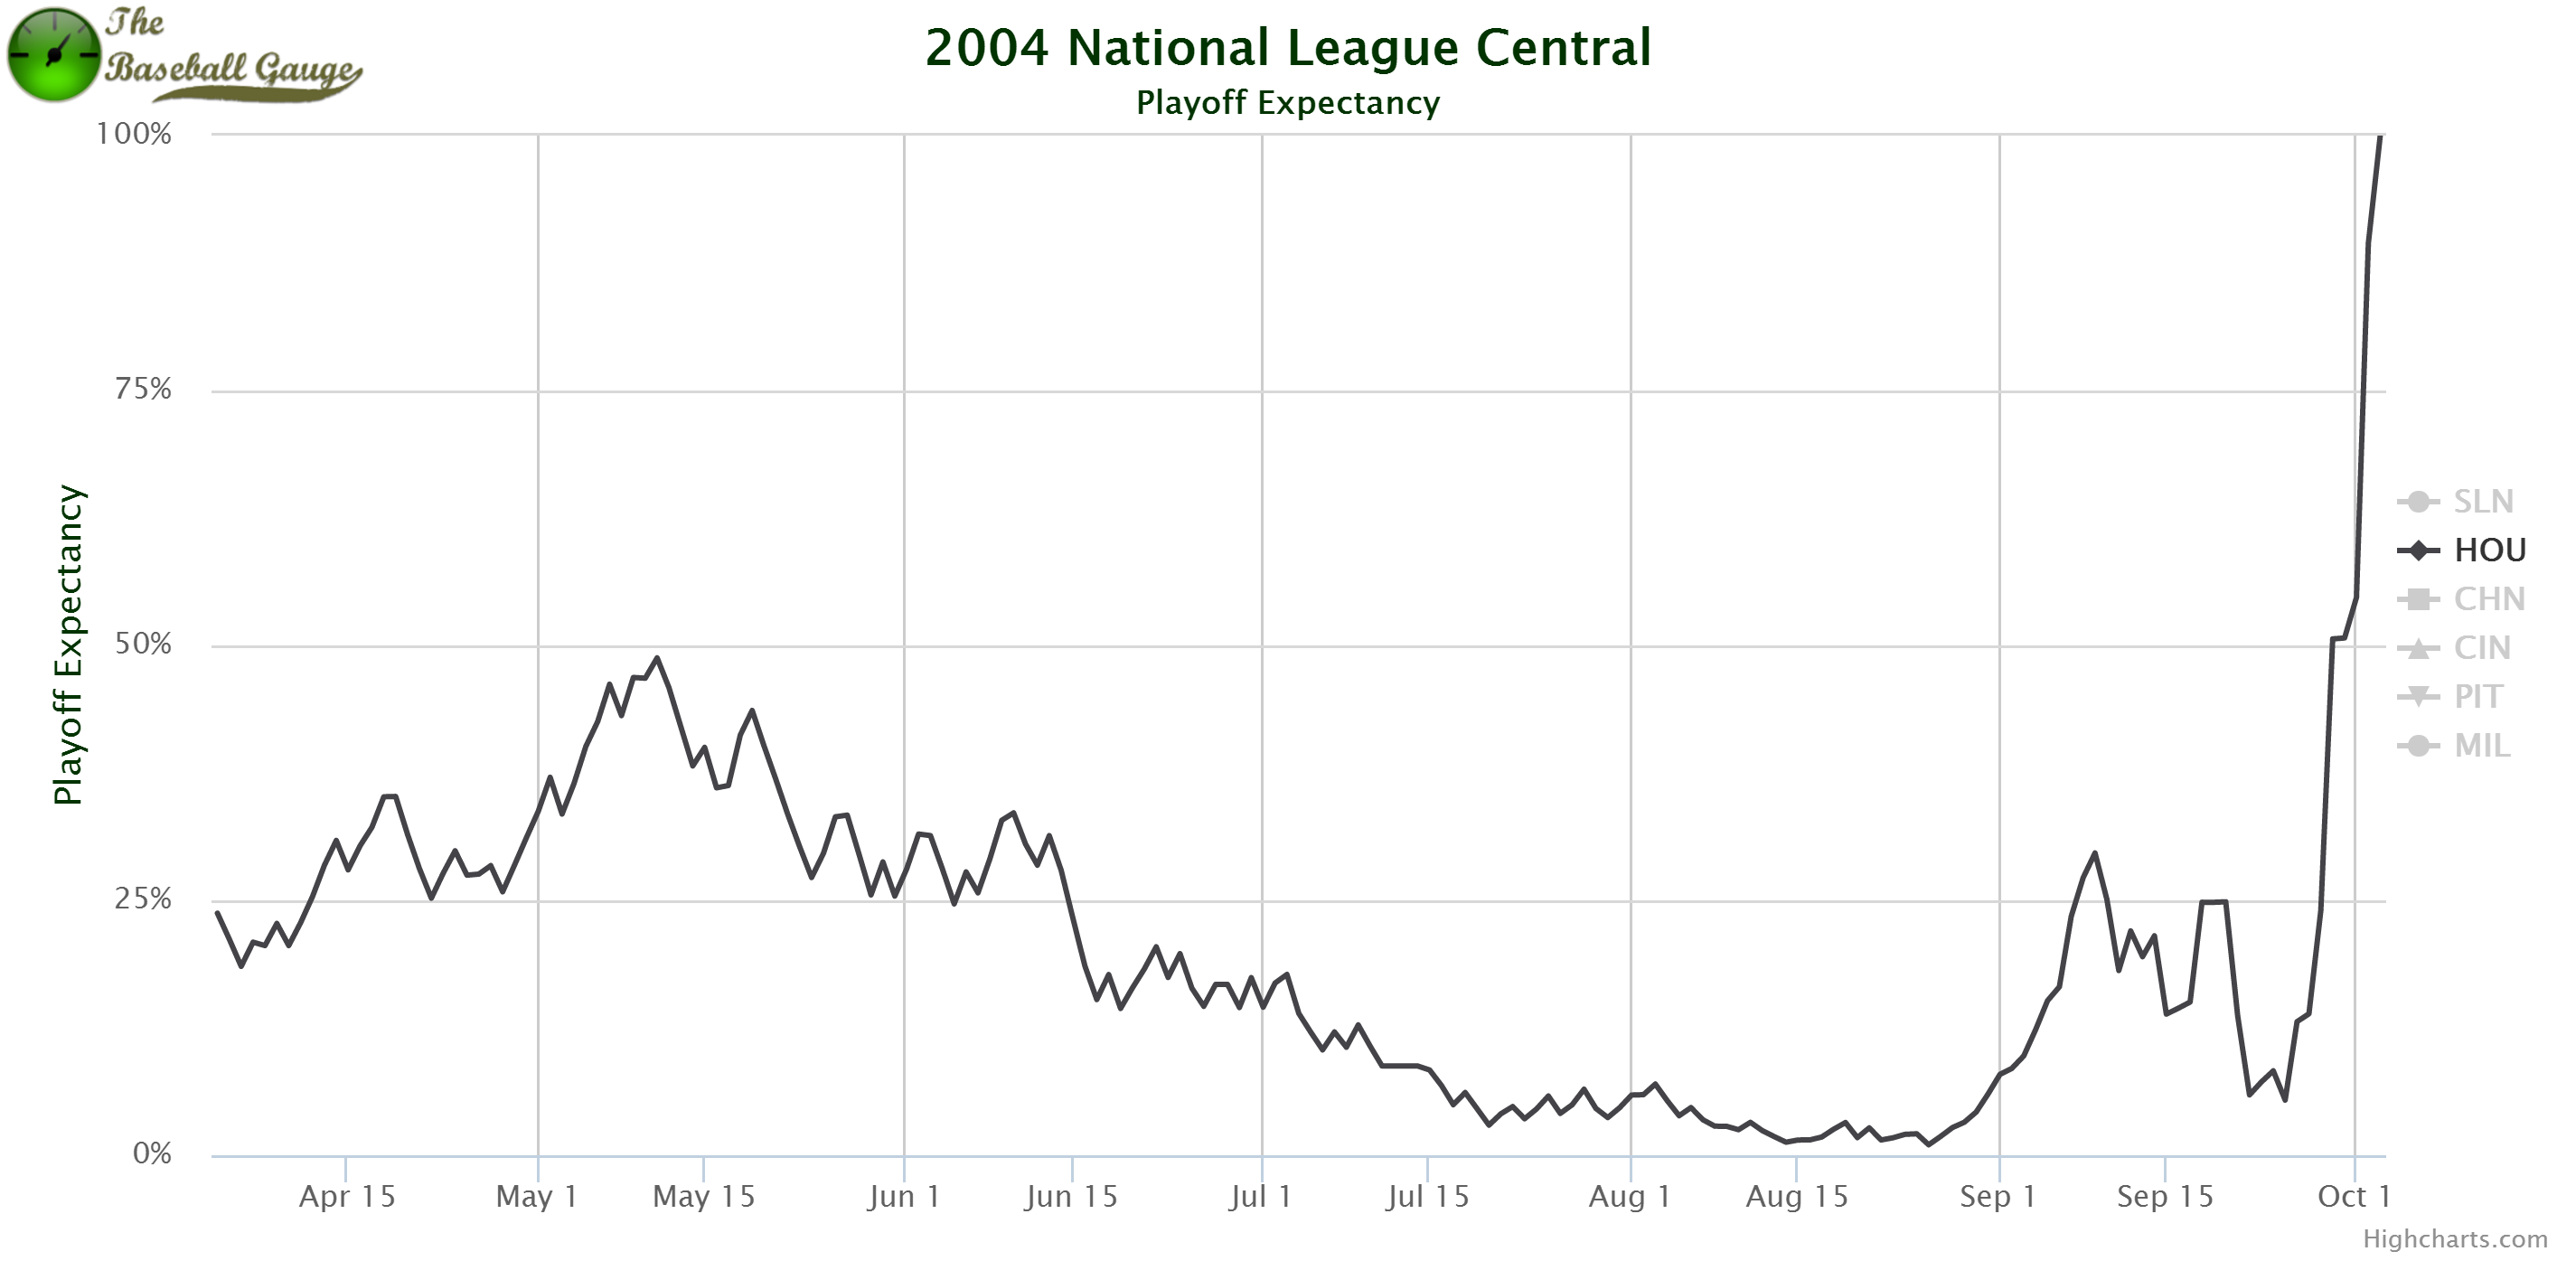
The Challenge:
On August 26th, the Astros were a game over .500 and trailed the Cubs (7 GB), Giants (6 GB) and Padres (5 GB) for the National League wild card. How they did it:
Not only did Houston have to surpass three teams to advance to the postseason, those three teams would all have winning records over the final 35 games of the season. That did not stop the Astros, as they would go 28-7 during that same stretch, which would include a 12-game winning streak from August 27th to September 8th. During the winning streak, the Astros offense averaged over nine runs per game, led by Jeff Bagwell, Craig Biggio, Lance Berkman, Jeff Kent & mid-season trade acquisition Carlos Beltran. They took the lead in the wild card on October 2nd with one game left to play and clinched the next day with a 5-3 win over the Rockies Postseason:
After losing to the Braves in the 1997, 1999 & 2001 NLDS, the Astros finally got revenge by beating Atlanta in five games. They went on to face their division rival Cardinals in the NLCS, taking the series a full seven games. In the sixth inning of the final game, Houston had a 2-1 lead before the Cardinals scored three runs on the Cy Young Award winner Roger Clemens. The Astros would only get one base runner in the final three innings as the Cardinals advanced to the World Series.
The Challenge:
On July 18th, the defending champion Yankees were in fourth place in American League East and behind their hated rival and division leading Red Sox by 14 games. How they did it:
In the second year of free agency, the 1978 Yankees roster was filled with high priced stars, clashing egos and colorful personalities, which led them to be referred to as “The Bronx Zoo”. In late July, manager Billy Martin went off on Reggie Jackson and owner George Steinbrenner to reporters. Before he could be fired, he resigned and was replaced by laid-back Bob Lemon. Under the new leadership, the Yankees went 47-20, highlighted by a four game sweep in Boston in mid-September which would leave the two teams tied for the division lead. The series would later be referred to as the “Boston Massacre”. They finished tied after 162 games at 99-63, so a tiebreaker was played at Fenway Park (chosen by coin flip). During the 7th inning, the Red Sox were leading 2-0 and had a win expectancy of 81.6%. That is until light-hitting Bucky Dent hit a three-run homerun that gave the Yankees the lead they wouldn’t relinquish. Postseason:
For the third straight year, the Yankees defeated the Kansas City Royals in the ALCS. Then they would beat the Dodgers in the World Series for the second season in a row.
The Challenge:
On August 11th with 44 games left to play, the Giants were 13 games behind the crosstown rival Brooklyn Dodgers, who were 70-36 and appeared to be well on their way to their third World Series in five years. How they did it:
From August 12-27, the Giants won 16 straight games, cutting the Dodgers lead to five games. The race would go down to the final day of the season with the two teams tied after 154 games. This resulted in a best-of-three tiebreaker series. The game locations were decided by a coin toss, which the Dodgers won. However, they made a questionable decision to host the first game at home and play the second/third games on the road. After splitting the first two contests, the tiebreaker came down to the final (157th game). Down 4-1 in the 9th inning, the Giants series win expectancy was as low as 3.2%. But a 4 run rally culminating with Bobby Thomson’s “Shot Heard ‘Round the World” won the Giants the pennant. Years later, it was revealed that the Giants were stealing signs from center field at their home park during the series. World Series:
After an exciting regular season finish, the Giants lost the World Series to the Yankees, who were in the middle of winning five World Series in a row. The 1951 World Series was the first for rookies Willie Mays and Mickey Mantle and the final for Joe DiMaggio.
The Challenge:
On September 5th, the Cardinals were 10 games behind the Brewers in the division and 8.5 games behind the Braves for the Wild Card with 21 games remaining. How they did it:
From September 9-11, the Cardinals swept a three game series from the Braves, cutting their wild card lead from 7.5 to 4.5 games. It didn’t stop there as St. Louis went 11-5 the rest of the way, while the Braves went 5-10.
The Cardinals comeback coincided with the Tampa Bay Rays in the American League, which ultimately culminated in “Game 162″ on September 28th. Tied with Atlanta on the final day, the Cardinals defeated Houston, then retreated to the clubhouse to watch the end of Braves game. Needing a win to stay alive, the Braves had a 3-1 lead against the Phillies going into the seventh inning, before Philadelphia tied it in the ninth. Finally, the Phillies won it in the 13th, allowing the Cardinals to clinch the wild card. Postseason:
The Cardinals defeated the 102-win Phillies in the NLDS. Then they went on to beat the division rival Brewers in the NLCS. Finally, they continued the dramatics of the regular season in the World Series vs the Rangers. During the 9th inning of game 6, the Cardinals had a 2.1% series win expectancy, but rallied behind clutch hits from David Freese and Lance Berkman to force a game 6 and eventually win the series.
The Challenge:
On September 20th, with just 13 games left to play, the Cardinals were tied for second place with the Cincinnati Reds while 6.5 games behind the Phillies. At that point, Philadelphia was so close to clinching that they printed World Series tickets. How they did it:
1964 is remembered much more for the Phillies collapse (and manager Gene Mauch’s questionable managerial moves) than the Cardinals comeback. But just about any comeback requires that other teams under-perform to some extent. The final stretch of the 1964 season produced one of the greatest pennant races in history that saw three teams occupy first place during the final week of the season. In the final 13 games, the Cardinals went 10-3, which included a three game sweep of the Phillies which moved them from third to first place. World Series:
The Cardinals defeated the Yankees in seven games. Shortly after the series, Cardinals manager Johnny Keane resigned and was quickly hired by the Yankees to be their new manager. In fact, Keane had officially resigned during the pennant race in September.
The Challenge:
On August 5th, the Mets were in last place in the National League East and 11.5 games behind the division leading Cardinals. How they did it:
The “Ya Gotta Believe” Mets got some help from the other National League division (West), who beat up on the Mets Eastern division rivals. Over the final two months of the season, every team in the East, save for the Mets, lost more games than they won while all but one Western division team won more than they lost. But that’s not to take away from the Mets’ accomplishment. They went 34-19 after August 5th and won the division by a game and a half. The pitching staff, led by Tom Seaver, Jerry Koosman & Jon Matlack, had a league best 2.63 ERA over the final two months of the season.
They finished the season just three games over .500 (82-79) and have the lowest winning percentage (.509) of any pennant winning team in history. Postseason:
The Mets defeated the Reds in the NLCS, which was highlighted by the infamous Bud Harrelson and Pete Rose fight. However, the Mets would lose the World Series to the Oakland A’s in 7 games. The series would also be the final games of Willie Mays’ career.
The Challenge:
On July 5th, the Braves were in dead last and 15 games behind the leading Giants. They appeared to be on their way to their 12th consecutive sub-.500 season. What sets the 1914 Braves apart from the other teams on this list is that their comeback began earlier than any other team (just 66 games into the season). How they did it:
The “Miracle Braves” finished the season 68-19 (after starting off 26-40). The turnaround wasn’t the result of one major change, but that of the entire team. Manager George Stallings used a strict platoon with his left fielders Joe Connolly (158 OPS+) and Ted Cather (115 OPS+), something that hadn’t been done regularly by 1914. Bill James became the ace of the staff, going 19-1 with a 1.55 ERA in 214 innings after July 5th. In the second half of the season, all but one regular batter had a higher OPS than they did in the first.
Not only did they leapfrog seven National League teams, they did it so easily that they finished ahead of the second place Giants by 10.5 games. In fact, they took over sole possession of fist place on September 8th and held on to that spot for the next four weeks. From July 5th until the end of the season, the Braves outscored their opponents by almost 2 runs per game. World Series:
The Braves swept the defending champion and highly favored Philadelphia Athletics in four games.
The Challenge:
On August 19th, the Cardinals were in fourth place and ten games back of the first place Cubs with 37 games remaining, 23 of which were on the road. Of the 100,000 simulations from that date, the Cardinals would win the pennant just 160 times, or one in every 625 simulations. How they did it:
As if that wasn’t a big enough hurdle, the three teams in front of the Cards on August 19th would all play .500 or better the rest of the way. But that is what makes their comeback even more impressive. Sparked by the midseason trade in which they acquired future Hall of Famer Burleigh Grimes, the Cardinals went 31-6 over the remaining 37 games and outscored their opponents by more than 100 runs. They tied for first place on September 16th and won the pennant by 2 games. On the final game of the season, after having already clinched the pennant, Dizzy Dean made his major league debut and allowed just one run and three hits in a complete game victory.
The club’s September run included a couple of crazy stories. On September 15th, the Cardinals were in Brooklyn to face the first place Dodgers. With the team being just a game behind in the standings, the next day’s starting pitcher Flint Rhem disappeared. Rhem, who was known to enjoy libations, even during prohibition, wouldn’t reappear until two days later. The story came out that Rhem said to have been kidnapped by several men and forced to drink liquor. However, it was later discovered that manager Gabby Street had concocted the kidnapping story.
Fortunately for the Cardinals, this did not hinder their comeback attempt. But maybe because they had the benefit of a soothsayer, who would instruct manager Gabby Street who to pitch and would correctly predict the outcome of those games. It seemed to work flawlessly until they reached the World Series. World Series:
The Cardinals lost to Connie Macks’ Philadelphia A’s in 6 games. But the following season, they would exact revenge on the A’s by winning the 1931 World Series in seven games.
The 1930 Cardinals are rarely, if ever mentioned among the greatest comebacks in baseball history. Perhaps it is because their comeback didn’t also include a great collapse from a league rival. Perhaps it is because their roster didn’t include sexy names or inner circle Hall of Famers. A few of the Cardinals that did make it into the Hall of Fame are those that many feel are undeserving or are in the bottom tier (Jim Bottomley, Jesse Haines & Chick Hafey). Whatever the reason, the 1930 St. Louis Cardinals deserve the credit of overcoming the most difficult odds of winning the pennant in baseball history.
New Graphs
Recently, I started upgrading the graphs on the site. Previously, the graphs were generated with jpgraphs, which uses php and generates an image on the user’s browser. The new graphs are generated using highcharts, which uses javascript and allows the user to interact with the graph. The biggest difference is the user can now hover their mouse over the plot lines to see the data from each play.
I feel that these new graphs are a big step forward in following the play by play of each postseason series and I hope you feel the same.
Individual Player’s Series Win Probability Added (sWPA)
When I originally added the postseason data, I included a page for the top plays in postseason history. This shows which plays had the biggest difference in sWPA from before and after the play. In the new update, each player is credited/debited sWPA based on their involvement in the play. I decided to use the same method for allocating WPA that is used at Baseball-Reference.
sWPA vs wsWPA
wsWPA is World Series Win Probability Added. This is not just the win probability of winning the series, but winning the World Series. This is calculated as sWPA divided by (# of series before the World Series * 2). Obviously, the sWPA in the World Series would be equal to the wsWPA.
Example: Francisco Cabrera’s walk-off 2-run single in the 1992 NLCS increased the Braves chances of winning the series by 74% (26% -> 100%). Since the NLCS is one series away from the World Series, this is how we calculate wsWPA:
74% / (1 * 2) = 37%
This tells us that Cabrera increased his team’s chances of winning the World Series by 37%.
A 20% sWPA play in the Wild Card game would be divided by six since it is three series away from the World Series:
(20% / (3 * 2)) = 3.33%
wsWPA is a good way to compare the importance of plays from different types of series
Note
I have included regular season tiebreakers in the postseason data. While they are not technically postseason games, they are pivotal in World Series win probability.
Before baseball had a problem with performance enhancing drugs, it had a problem with recreational drugs. This was highlighted by the “Pittsburgh Drug Trials” of 1985. During these trials, a number of baseball players took the stand to discuss cocaine use in baseball. One of those players was Keith Hernandez.
At the time of the trials, Hernandez was a member of the New York Mets, having been traded in 1983 for pennies on the dollar. While on the stand, he suggested that 40% of ballplayers were using cocaine. Shortly after, Whitey Herzog (Hernandez’s former manager with the Cardinals) publicly agreed with Hernandez, stating that there were 11 “heavy users” on their team in the early 1980’s.
Herzog continued to say this…
It got so bad that when we went to Montreal, which was where they all seemed to get it, I had to have us fly in on the day of the game. That way, I knew we`d play decent for one night, even though the rest of the trip might be a lost cause
I decided to take a look at how well the Cardinals fared in Montreal on the first game of a series versus the remainder of the series. Herzog managed the Cardinals for 73 games in 1980 before becoming the team’s general manager in August. At the end of the season, he would became the Cardinals full-time manager. I limited my search to Herzog’s tenure in 1980 until 1983. Since we don’t have the Cardinals travel logs and flight schedules, we have to assume that they actually did in fact arrive on the day of the first game in each series.
For the sake of record keeping, a one game series will be counted towards the “first day’s” record, even though there aren’t subsequent games in the series. Also, a couple of these series begin with doubleheaders. These will also be counted towards the “first day’s” record.
A few of the first games of the series began around 2PM, when the Cardinals were in St. Louis the previous day. A flight from St. Louis to Montreal takes approximately 4.5 hours while also losing an hour changing time zones. The team would have to leave St. Louis very early to make it to Montreal if you factor in trips to and from the airport. Realistically, it would be very difficult to have regular game day preparation (ie batting practice) with this travel schedule. But for the sake of Herzog’s theory, we’ll allow it.
1980
Date
STL
MON
W/L
7/10/80
3
4
L
7/11/80
5
3
W
Date
STL
MON
W/L
9/29/80
2
5
L
9/30/80
2
7
L
10/1/80
0
8
L
1981
Date
STL
MON
W/L
5/25/81
3
5
L
5/26/81
3
4
L
5/27/81
1
4
L
Date
STL
MON
W/L
8/14/81
3
1
W
Date
STL
MON
W/L
9/15/81
3
2
W
9/15/81
3
4
L
9/16/81
7
1
W
9/16/81
3
4
L
9/17/81
7
4
W
*An interesting fact about the strike-shortened 1981 season is that the Cardinals finished with the best overall record in the National League East, but did not win the first or second half titles. The Expos would win the 2nd half title and advance to the postseason.
1982
Date
STL
MON
W/L
6/7/82
2
3
L
6/8/82
5
4
W
6/9/82
1
5
L
Date
STL
MON
W/L
7/29/82
3
4
L
7/30/82
4
5
L
7/31/82
10
1
W
8/1/82
4
5
L
Date
STL
MON
W/L
9/27/82
4
2
W
9/28/82
4
5
L
1983
Date
STL
MON
W/L
4/21/83
5
6
L
Date
STL
MON
W/L
7/28/83
3
2
W
7/28/83
10
1
W
7/29/83
2
7
L
7/30/83
3
2
W
7/31/83
5
6
L
Date
STL
MON
W/L
9/19/83
0
3
L
9/19/83
3
6
L
9/20/83
1
10
L
Final Tally
Day
W
L
W%
R
RA
Pyth
First Day
5
9
.357
47
48
.490
Remaining Days
6
12
.333
67
85
.394
The overall record (.357 win %) on the first day was slightly better than the record on the other days (.333 win %). But the Cardinals played significantly better when we look at their pythogorean record, which uses runs scored and runs allowed.
This is hardly enough games to be considered an adequate sample, and there are too many assumptions to make a definitive assessment. We don’t know for sure how many times they actually traveled on the day of the first game. My guess is that they did it for days where the first game was a night game, although I do question if they did it for afternoon games. With the information we have, it does appear that an altered travel schedule did help the team to some extent.
The mere fact that a manager would even have to consider this type of travel schedule to keep their players clean is quite sad. Cocaine use was a major problem not only in baseball, but in many American cities. However, the Cardinals would win the World Series in 1982, so their quality of play wasn’t diminished too much.
For further reading on the Pittsburgh Drug Trials, consider reading The Pittsburgh Cocaine Seven, by Aaron Skirboll.
Bryce Harper is on a tear, hitting multiple homeruns in consecutive games. At just 22 years old, he already has 7 career games with multiple homeruns. This got me stuck in a play index wormhole (If you aren’t using play index at Baseball-Reference.com, you are missing out). Here are some cool (my opinion, hopefully yours as well) lists I came up with.
*Note: These lists include stats from 1914-2015
Most Career HR without a Multi-HR Game:
Player
HR
Lou Piniella
102
Grady Hatton
91
Dom DiMaggio
87
Del Unser
87
Johnny Edwards
81
Will Venable
78
Jason Kendall
75
Olmedo Saenz
73
Tom Brookens
71
Jerry Hairston Jr
70
Glenn Hubbard
70
Fewest Career HR with a 3-HR game:
Player
HR
Merv Connors
8
Bill Glynn
10
Tuffy Rhodes
13
Jose Ortiz
14
Don Leppert
15
Jim Tobin
17
Del Wilber
19
Jim Pendleton
19
Manny Jimenez
26
Steve Boros
26
Most Career HR without a 3-HR game:
Player
HR
Rafael Palmeiro
569
Gary Sheffield
509
Fred McGriff
493
David Ortiz
470
Vladamir Guerrero
449
Jim Edmonds
393
Graig Nettles
390
Dwight Evans
385
Frank Howard
382
Tony Perez
379
Most Career 3-HR Games:
Player
HR
Sammy Sosa
6
Johnny Mize
6
Mark McGwire
5
Carlos Delgado
5
Dave Kingman
5
Joe Carter
5
Barry Bonds
4
Alex Rodriguez
4
Albert Pujols
4
Ernie Banks
4
Lou Gehrig
4
Willie Stargell
4
Aramis Ramirez
4
Ralph Kiner
4
Steve Finley
4
Lance Parrish
4
Most Career Multi-HR Games:
Player
HR
Babe Ruth
72
Barry Bonds
71
Sammy Sosa
69
Mark McGwire
67
Willie Mays
63
Hank Aaron
62
Alex Rodriguez
61
Ken Griffey Jr
55
Jimmie Foxx
55
Frank Robinson
54
Manny Ramirez
54
Players with 2 Career HR (both in same game):
Player
Year
Babe Birrer
1955
Jess Doyle
1925
Derrick Gibson
1999
Brandon Harper
2006
Sammy Holbrook
1935
Tim Hyers
1999
Jack Knight
1926
Derek Lilliquist
1990
Doug Loman
1984
Brian McCall
1962
Bobby Pfeil
1971
Glen Stewart
1943
Only Players with 3-HR Games for 3 Different Teams:


